How I Use Roadmaps Data to Decide What to Teach Each Day
September 15, 2026
By Damian Coleman
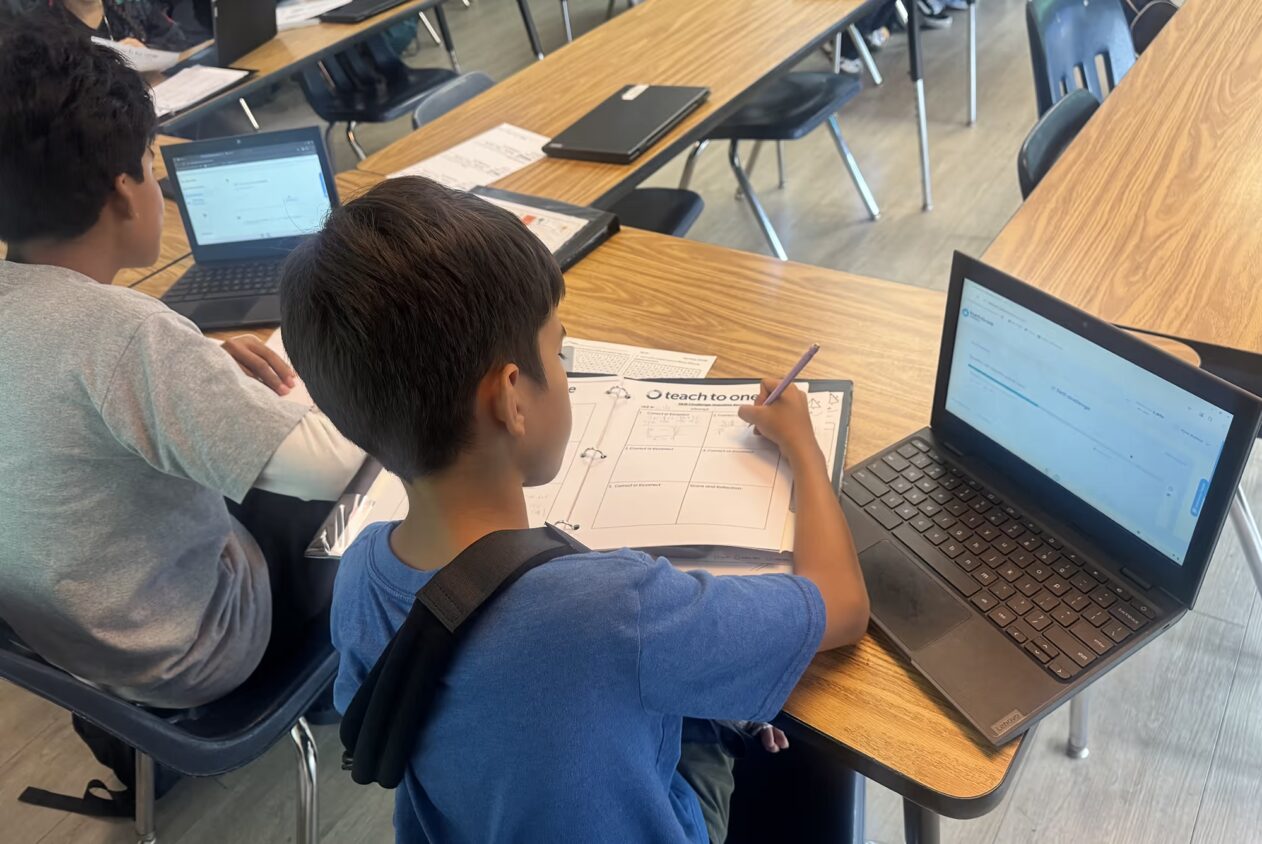
This is my second full year using Teach to One Roadmaps with my 6th through 8th graders, roughly 270 students in all. In the past, I built out my entire curriculum before the year started. That’s very different now. Now it’s, look at the data today, and for next week we know what we need to teach. If most of our kids haven’t passed an essential skill, we teach that first before we try to hit the target skill. To do that, we have to check the data all the time, which is kind of fun, honestly.
Getting to 100% Diagnostic Completion
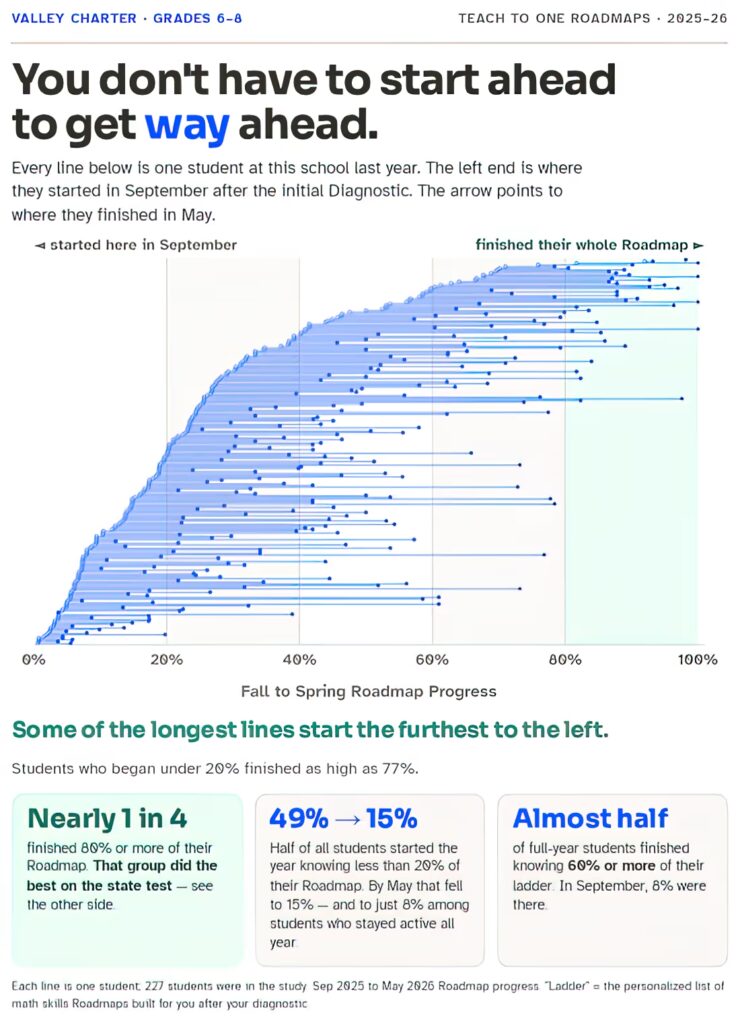
None of that works until the Diagnostic is complete, so that’s always the first goal. This year one of my classes hit 100% completion in about a day and a half, start to finish. We started it toward the end of one class period, then finished it the next day with a full period.
Two things got us there. Before we started, I showed my students a graph that Michelle Palmer, our Teach to One Roadmaps Implementation Specialist, had given us of the previous year’s data. The graph showed where kids had started the year and how far they’d come by the end of the year. Some of the kids who scored the fewest skills at the beginning improved the most by the end. I wanted my students to see that it doesn’t matter where you start.
Secondly, I told my students that if they’re stuck on a Diagnostic question for a long time, they probably don’t know it yet, and that’s fine. Move on, this isn’t a test and it’s okay not to know something. Sitting there too long just wastes the time we could be spending learning what they don’t know.
Checking Data Almost Every Day
Once the diagnostic generates a Roadmap for each student, the first thing I look at is where everybody landed overall. I’m a numbers guy, so I go through and look at the numbers, not even level by level yet, not trying to put people together. I just want to see if there are a lot of kids clustered around certain skills. That’s my first thing, just to get a vibe on where my students are before I plan anything.
If I could tell another teacher one thing about Roadmaps, it would be this: trust the data. It’s okay to let go of having to teach kids every single thing. Trust that the kid knows that skill, even if it’s not mastered in the way we might picture. You don’t have to go back and reteach the whole skill. You can give them an activity, push them further, but you don’t have to teach a whole lesson on something they’ve already shown they know. If the data says it, trust it.
My assistant teacher and I have the same prep period, period four, so four out of five days a week throughout the year we sit down together and log into Roadmaps to look at the data. With the data from Roadmaps, we know what we need to teach. Roadmaps shows us where the students are.
Grouping by What Each Student Needs Next
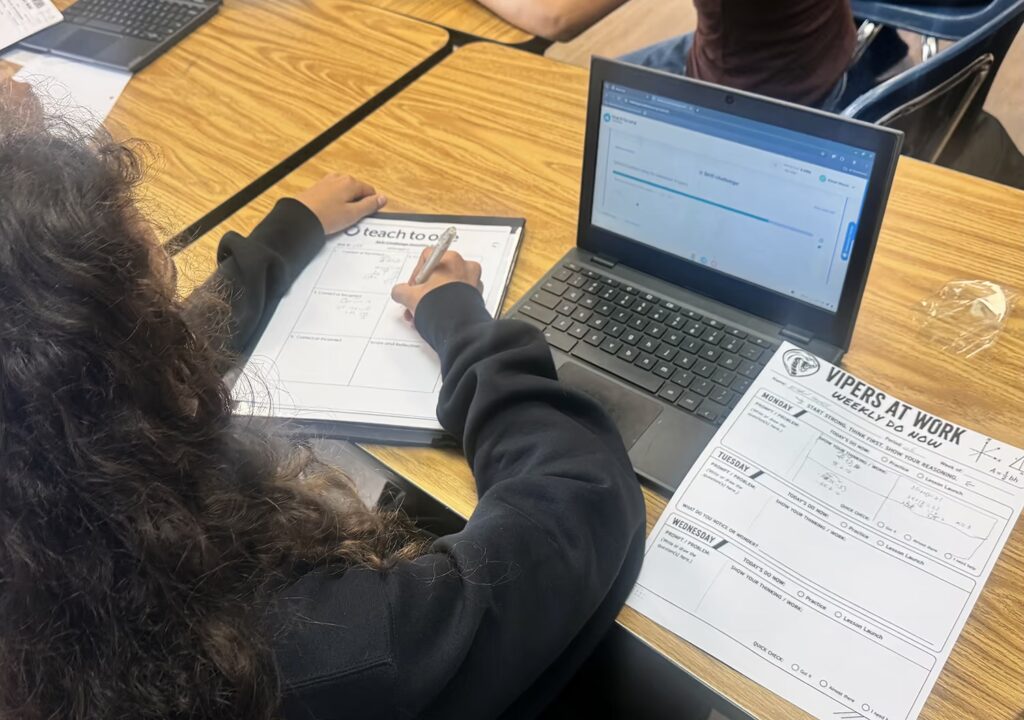
We teach in three stations, and we use the data almost every day to group kids for the direct lesson they need. The goal this year is to not have kids sit through direct lessons on skills they’ve already mastered. If one of my groups already passed the skill everyone else is working on, that group will be taught a different essential skill. I don’t want to hold kids back, and I don’t want to bore them.
Groups aren’t fixed. We revisit them every three to six days based on the next skill each group is ready to target. Because it’s early in the year, we revisit groups closer to every six days, but we’re hoping to get down to three. Tomorrow, for example, my eighth graders get new seats because we’re starting a new target skill, and the data tells us who needs more foundational work before they can take it on.
Trust the Data
That’s easier to do when you’ve watched kids actually take the diagnostic. We have GoGuardian, so I can pull up all the screens and walk around. We required students to show their work on a template for every problem, so even a glance tells me whether they’re putting in effort. If they’re not, that’s a conversation you have to have with them, not a reason to throw out the data.
What This Has Meant for My Students
The biggest thing I’ve noticed is confidence. Kids used to walk in and tell me they couldn’t do math, that they’d never understand it. Now more of them walk in believing they can actually learn what I’m about to teach, because they know exactly which skills are theirs.
I saw this most with a group of my IEP students. I gave a task to eight of my regular eighth graders, four of them had IEPs. The four IEP kids worked more independently, needed less help, and had maybe three questions between them. My Algebra kids, who’d also passed the same skill, asked something like 100 questions. I think that came down to confidence. I told my IEP kids they’d already passed the skill and didn’t need me, and something clicked. They believed they could do it, and they did.
Imagine being able to fill in the gaps for kids individually, instead of trying to figure out which few gaps to teach the whole class. Every kid gets what they need without me having to stop teaching content. That’s the goal, and it’s what keeps me checking the data every single day.

About the Author
Damian Coleman is a math teacher at Valley Charter Middle School, where he has taught for the past 14 and a half years. He has spent all 29 years of his teaching career in the San Fernando Valley. He has used Teach to One Roadmaps with his students for two and a half years.
